What was counted
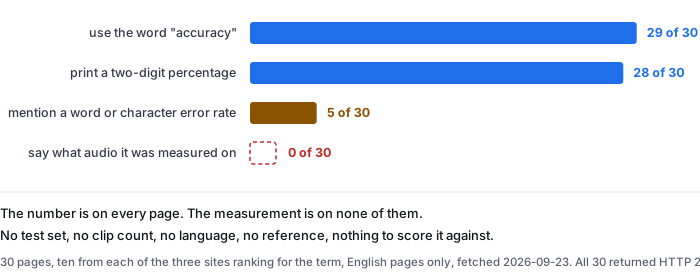
This is one scan of 30 pages on one date. It is not a ranking and it is not a review of the products.
- Pages — 30, ten from each of three sites, all fetched on 2026-09-23
- How they were chosen — from each site's own sitemap.xml, English pages only, language variants (per-language directories and per-language slugs) excluded
- How they were read — full HTML downloaded, scripts and styles removed, tags stripped to plain text, then searched with fixed patterns
- Response codes — 30 of 30 returned HTTP 200
- What was searched for — eight patterns: the word accuracy, a two-digit percentage, a word or character error rate, a test set or reference transcript, raw data, how digits are written, script variants, punctuation
- Scope — the pages on those three domains. Nothing hosted elsewhere counts, even if it exists
Every pattern that came back with a low count was then read by hand in context before it went on this page. That step matters: one pattern matched 13 times on the word benchmark, and reading the sentences showed all 13 were marketing comparisons with no data attached, so they are not counted as data here.
The count
- Use the word accuracy — 29 of 30
- Print a two-digit percentage — 28 of 30 (10 of 10, 10 of 10 and 8 of 10 by site)
- Mention a word or character error rate — 5 of 30, all five on the same site
- Describe a test set, evaluation set or reference transcript — 0 of 30
- Publish raw output, a CSV, a dataset or a repository — 0 of 30
- Say how numbers are written in the transcript — 0 of 30
- Mention Simplified or Traditional Chinese — 0 of 30
- Mention punctuation or capitalisation — 2 of 30
The pattern is consistent across all three sites. The words and the percentages are everywhere; the conditions are nowhere. One of the three goes further than the other two and publishes error-rate bands per language, plus a comparison chart against named competitors — that is more method than anyone else shows, and it still does not say what audio the numbers came from.
The three things all thirty leave out
These are not small omissions. Each one is the difference between a number you can check and a number you have to take on faith.
- What it was measured on. No page states the audio: how many clips, how long, what language, recorded how, with what background. A percentage with no audio behind it cannot be reproduced, and two tools quoting the same percentage may have measured nothing in common.
- What it was measured against. Not one page mentions a reference transcript — the hand-written correct text that every error rate is computed against. Without one there is no error count, only a claim.
- What counts as an error. Zero of 30 discuss how digits are written, and zero mention script variants. Both change the answer on the same unchanged audio: whether 2026 and twenty twenty-six are the same string, and whether a Traditional character written where the reference has a Simplified one is a mistake, decides the score before any model is involved.
We know the third one changes the answer because it changed ours. On one 23.088-second Mandarin clip with 97 reference characters, the same model output scored 43.3% wrong compared character for character, 7.2% after the script was converted, and 6.2% after digits were normalised as well. Same audio, same output, three numbers — because nobody had said which comparison was meant.
What a figure you can check has to include
Four things, all of which cost the publisher nothing but the discipline to write them down.
- The audio — clip count, length, language, and whether the language was forced or detected
- The reference — where the correct text came from, and how many characters or words it contains
- The comparison — which normalisation was applied before scoring, stated explicitly
- The output — the raw model text, published, so anyone can re-score it differently and say so
A figure published with those four is still only a measurement of one clip on one machine. But it is a measurement you can argue with, which none of the 30 is.
What this scan does not show
- English pages only. The same three sites serve many languages. Those pages were not read.
- Static text only. The HTML was read as delivered; no page was executed in a browser, so anything rendered later by script is not in these counts.
- These domains only. If any of the three publishes its method in a paper, a documentation site or a model card elsewhere, this scan would not see it. The claim here is narrow and literal: on the pages that rank for the term, the conditions are not stated.
- Pattern matching has edges. Only two-digit percentages were counted, so a figure written as words or as a single digit would be missed. The six zero-count rows were each checked with a second, looser pattern and still came back zero.
- One date. Pages change. This is a snapshot of 2026-09-23.
Where our own data is
Every number we publish ships with the four things above. The measurement scripts and the raw output are downloadable, so the counts on this site can be re-run and disagreed with.
- Raw data and the measurement scripts — github.com/supersophia8888-cloud/clipquill-asr-benchmark
- Archived copy with a DOI — 10.5281/zenodo.22826968, the concept DOI: that link always resolves to the newest version of this dataset, all versions.
- The same data as a dataset — huggingface.co/datasets/sophia8888/clipquill-asr-benchmark
- Error rate measured on eight English clips — the word error rate we measured
- Why one language's script changes the score — the three numbers from one Mandarin clip
- What the tool costs the machine it runs on — measured download size, timings and memory
Measure it on your own file
The transcriber is on the front page of this site. Drop in a video or audio file you already have, pick the spoken language, and read the transcript. Nothing is uploaded; the model runs in the browser tab and the file never leaves your device. Expect the first run to spend 78.4 MiB on the download and about a gigabyte of RAM, and every run after that to start straight away.